
Figure 3. Sequence Similarities for Identified Pauses.
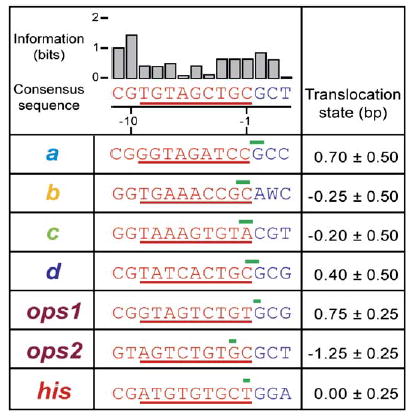
Table of DNA sequences underlying each pause, as mapped by transcription gels, along with the corresponding positions identified in single-molecule records. Top row: Consensus sequence generated from alignment of all pause regions: a–d sites, primary and secondary ops sites (ops1 and ops2, respectively), and his site. Also shown is the associated information, in bits, for each consensus base (Gorodkin et al., 1997). Lower rows: Downstream DNA sequences in advance of each pause are displayed (blue letters), along with the trailing sequence corresponding to the nascent RNA (red; with T substituted for U), with the region subtended by the RNA:DNA hybrid identified (red underline). The translocation state of RNAP at each pause site is indicated (green bars; the widths of these bars show estimated errors in localizing the position from single-molecule data).