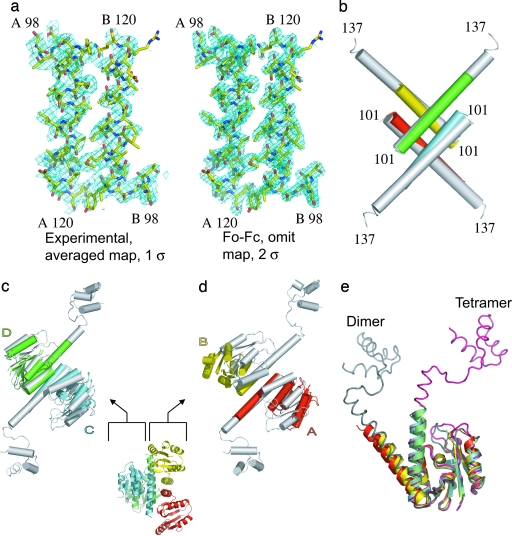
Fig. 2.
The structure of the apo, activated, resolvase fragment. (a Left) The experimental electron density map averaged, solvent-flattened, and calculated at 3-Å resolution is shown. (a Right) A map made with residues 98–120 in chains A and B omitted by using the coefficients Fo − Fc and calculated to 2.1-Å resolution. Both maps cover the same two E helix segments. (b) The E helix cores of the apo (chain A, red; chain B, yellow; chain C, cyan; and chain D, lime) and cleaved complex structure (white; PDB ID code 1ZR4) superimpose well. The catalytic domains in chains C and D also superimpose well on the cleaved complex structure (c), whereas chains A and B do not because these domains have moved apart (d). (e) Superimposing the four monomers by using their catalytic domains shows that the hinge region between the catalytic domain and E helix can bend to generate a variety of orientations. Representative catalytic domains from a dimer structure (chain A from PDB ID code 1GDT is shown in gray) and from the cleaved intermediate also are shown (chain A from PDB ID code 1ZR4 is shown in pink).

