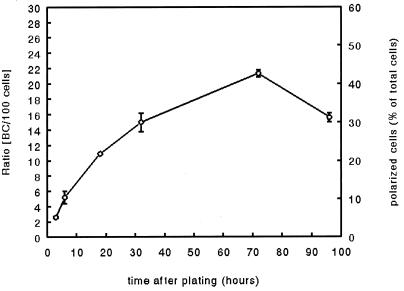
Figure 1.
Time-dependent polarity development of HepG2 cell cultures. Cells were plated at low density (±20% of surface occupied) on ethanol-sterilized glass coverslips and allowed to adhere and grow in normal culture medium. After various time intervals, cells were washed, fixed, and processed for determination of the degree of polarity (see MATERIALS AND METHODS). The left and right y-axes indicate the ratio [BC/100 cells] and the percentage of polarized cells, respectively. Data are presented as means ± SEM of at least three independent experiments, carried out in duplicate.

