Figure 1.
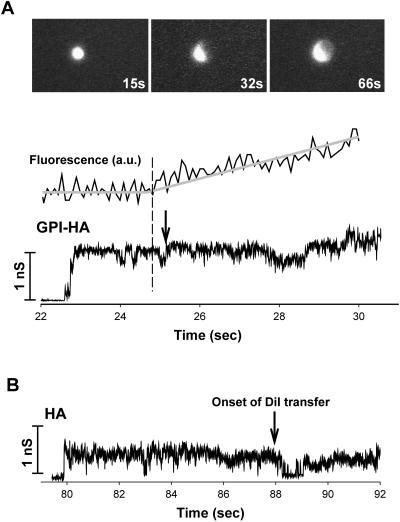
GPI-HA can induce fusion pores before lipid dye spread. (A) Fluorescence images illustrating the spread of lipid dye are shown in the top panel for GPI-HA cells. The 4%DiI-RBC is bright. The average brightness of a region of the GPI-HA cell adjacent to the RBC was measured (fluorescence, in arbitrary units [a.u.]) over time. The brightness before and after dye spread was fitted to straight lines. The intercept of the two lines (marked by the dashed vertical line) was similar to the time for onset of dye spread determined visually (arrow). The traces for pore conductance and fluorescence were synchronized in time; the times after acidification are shown on the pore conductance trace. (B) A typical conductance trace of a fusion pore for HA cells. For the HA cell, the moment of dye spread, indicated by the arrow, was determined visually. Fusion pore conductances were calculated every 5 ms from changes in the in-phase and out-of-phase components of cell admittance. Fusion was triggered in these experiments at pH 4.8 and 30°C.

