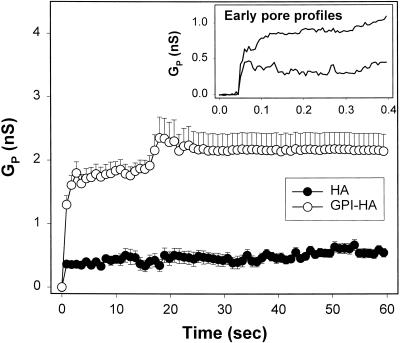
Figure 3.
The increase in conductance of GPI-HA and HA pores for the first minute after formation. Initially (inset), the average conductance was significantly larger for pores induced by GPI-HA (upper trace) than for pores generated by HA (lower trace). GPI-HA pores (○) eventually reached an average conductance on the order of 2 nS but did not enlarge further. HA pores (●) remained small. Average conductances of fusion pores were determined every 5 ms. Points were decimated for visual clarity. Bars indicate the SEM. The average pore conductance was calculated from 10 GPI-HA pores and 8 HA pores at pH 4.8, 30°C, with 4%DiI-RBCs.

