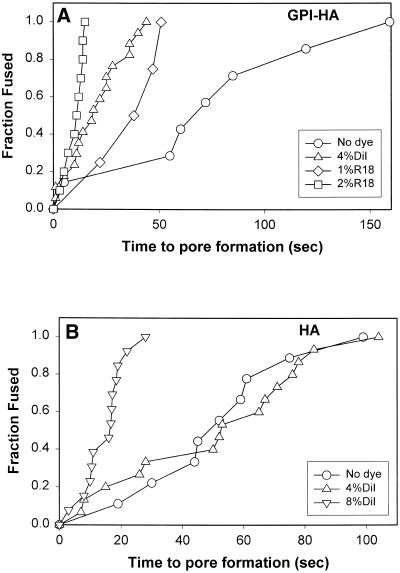
Figure 7.
Kinetics of fusion pore formation for GPI-HA cells (A) and HA cells (B). RBCs were either unlabeled (○) or labeled with DiI (▵ and ▿) or R18 (⋄ and □) at the indicated mole fraction ratios. (A) Cumulative distributions of waiting times from acidification until pore formation for experiments in which a GPI-HA pore formed before lipid dye transfer. Because the probability of fusion pore formation was low with unlabeled RBCs and those labeled with a low concentration of R18 (i.e., hemifusion usually occurred), in these cases the sample sizes are small. Each point represents the waiting time from acidification until pore formation for an individual experiment. (B) HA invariably induced pore formation. Including 4 mol % DiI (▵) did not speed up pore formation compared with unlabeled RBCs (○), but including 8 mol % DiI did (▿). Any fusion pores that formed for PKH-RBCs did so at long times after acidification and are not shown.

