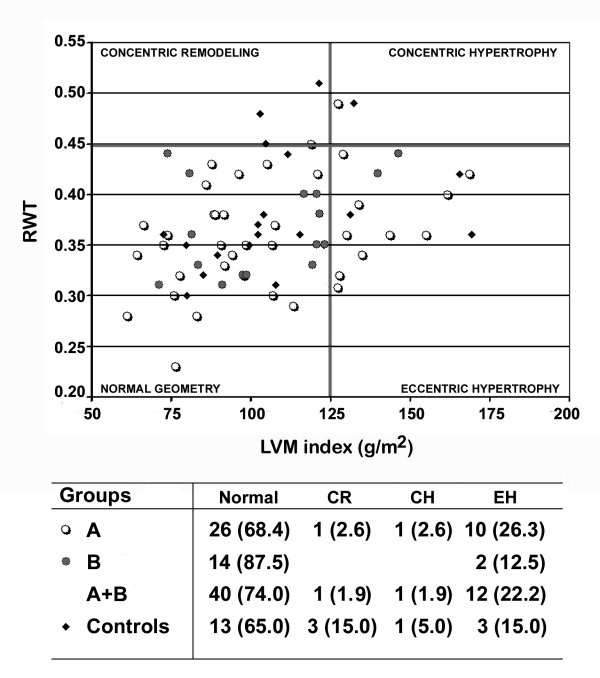
Figure 3.
Scatter plot illustrating the left ventricular remodeling in severe (open circles), partial (full circles) GHD and controls (squares). Numbers and percents (%) of the cases in each group are displayed in the table underneath. Legends: CR, concentric remodeling; CH, concentric hypertrophy; EH, eccentric hypertrophy; LVMi, left ventricular mass index; RWT, relative wall thickness.

