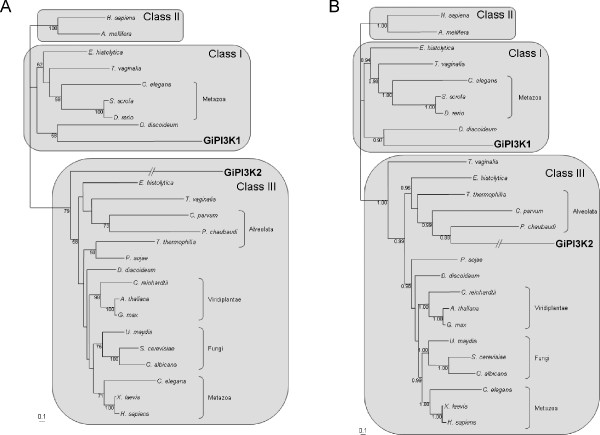
Figure 5.

Phylogenetic analysis of G. intestinalis PI3K homologs. Phylogenetic analyses of the different classes of PI3Ks including GiPI3K1 and GiPI3K2 (shown in the Class I and Class III clusters respectively). Shown are unrooted trees of representative sequences of Class I, Class II and Class III PI3Ks. A, Maximum likelihood analysis using PHYML [40]. Bootstrap values based on 100 replicates indicated at the nodes, only values above 50% are shown. B, Bayesian analysis of the same dataset using MrBayes v3.1 [39], posterior probabilities, calculated by MrBayes are indicated at the nodes, only values above 0.75 are shown. The branches leading to GiPI3K2 have been shortened by one third.
