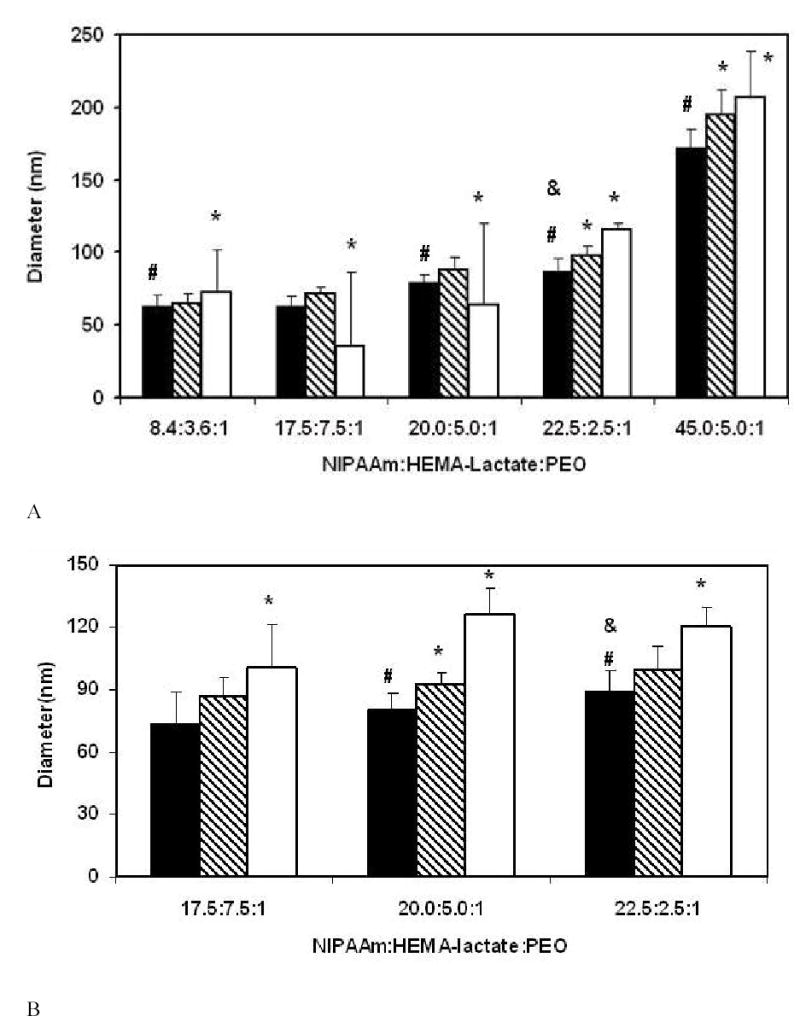
Figure 2.

Diameters of PEO-b-poly(NIPAAm-co-HEMA-lactaten) micelles at 40°C. (A) n=3, (B) n=5. The black bars represent data at 1 mg/ml solution, the hatched bars represent data at 0.1 mg/ml dilution, and the white bars represent data at 0.01 mg/ml dilution. Error bars represent the standard deviations (n=3). The * indicates that data of 0.1mg/ml and 0.01mg/ml are statistically different (p<0.05) from that of 1 mg/ml within each NIPAAm : HEMA-lactaten : PEO ratio. The # indicates that the data are statistically different (p<0.05) from data of polymers having a NIPAAm : HEMA-lactaten : PEO ratio equal to 17.5 : 7.5 : 1 in 1mg/ml solution. The & indicates that the data are statistically different (p<0.05) from data of polymers having a NIPAAm : HEMA-lactaten : PEO ratio equal to 20.0 : 5.0 : 1 in 1 mg/ml solution. Statistical comparisons were made using the double-sided t-distribution test (n=3).
