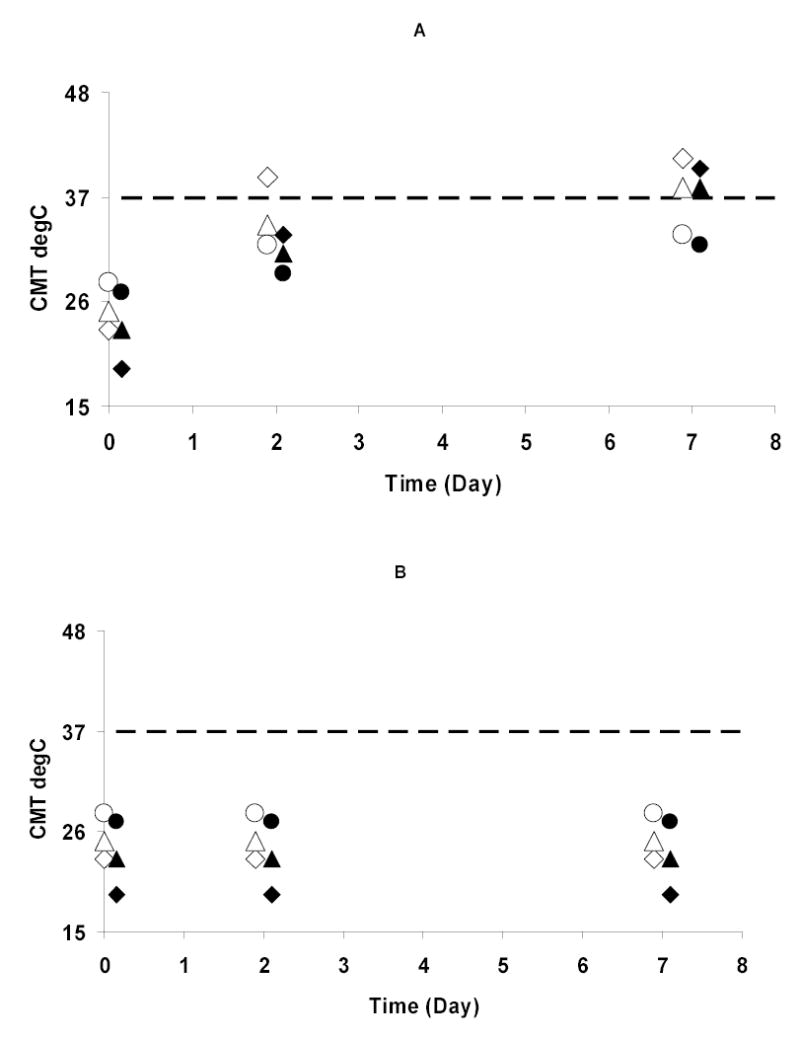
Figure 3.

CMTs of copolymers at 1 mg/ml as a function of time: (A) Hydrolyzed copolymers; and (B) Unhydrolyzed copolymers stored as solids. Closed symbols indicate n=5; open symbols indicate n=3. Diamonds indicate the NIPAAm : HEMA-lactaten : PEO ratio is 17.5 : 7.5 : 1. Triangles indicate the NIPAAm : HEMA-lactaten : PEO ratio is 20.0 : 5.0 : 1; Circles indicate the NIPAAm : HEMA-lactaten : PEO ratio is 22.5 : 2.5 : 1. The data are slightly offset in time for clarity.
