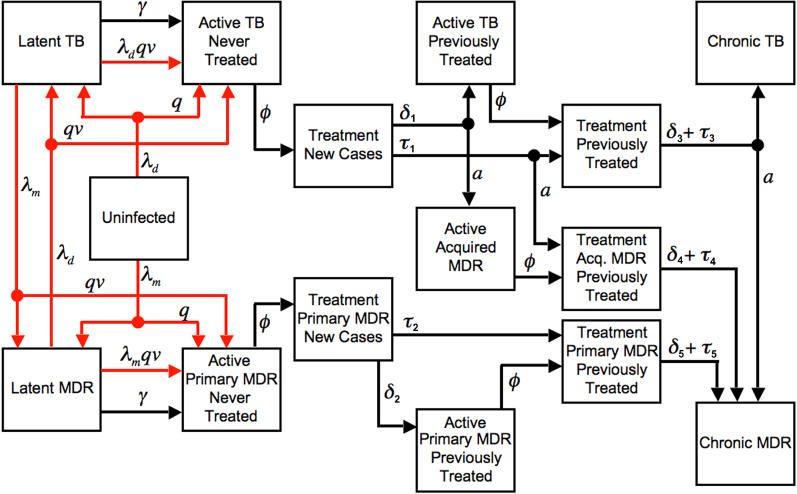
Figure 1. Structure of the TB Treatment Model.
Boxes represent health states, arrows represent population flow between health states, red arrows represent infection and re-infection. λ d is the force of non-MDR infection, λ m is the force of MDR TB infection, q is the proportion of new infections that break down rapidly, v is the immunity factor, γ is the rate of delayed progression from latent to active disease, ϕ i is the case detection rate, δ i is the treatment dropout rate, τ is the treatment failure rate, and a is the fraction of uncured patients acquiring MDR. Death can occur from any state (not shown). Cure can occur from any diseased state. Cured patients transition to the latent infection health state (not shown).

