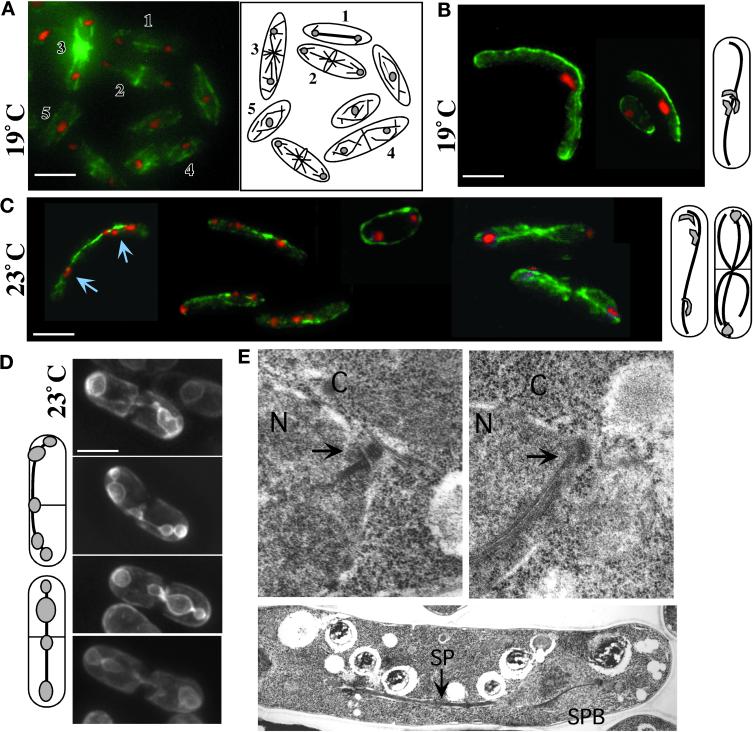
Figure 4.
Impaired chromosome segregation in gtb1-PL301 cells despite formation and elongation of a bipolar spindle. Immunofluorescence microscopy of microtubules (A–C), GFP nuclear membrane visualization (D), and TEM (E) are shown. Wild-type 972 h− cells are shown in A and E, top left. In A a field of wild-type cells shows different microtubule arrays: anaphase B spindle (1), telophase and central ring formation (2), postanaphase arrays (3), cytokinesis (4), and G2 (5). gtb1-PL301 cells with only the native copy of pkl1 present (B–E, right and lower) were grown at either 19 or 23°C as indicated. Microtubules (green) were visualized using TAT1 mAb. DNA staining (red) was with Hoechst. The cells shown in A–D are 3D projections of microtubules present throughout the cell taken at 0.2 μm spacing using an automated fine focus and CCD camera (see MATERIALS AND METHODS). Diagrams to the right of B and C and left of D indicate the predominant phenotype of the mutant observed at that temperature. Chromosome behavior is different at 19°C (B) versus 23°C (C and D). At 19°C chromosomes generally remained aggregated and nonsegregated (also see Figure 1C), whereas at 23°C chromosomes segregated to the poles or trailed along the spindle. Arrows in C indicate trailing chromsomes. (D) The cytochrome P-450 NADPH reductase first 80 amino acids fused to GFP (see MATERIALS AND METHODS) was used as a nuclear membrane marker in the mutant. In S. pombe the nuclear envelope collapses around the spindle, and mis-segregating chromosomes are evident as bumps along its length. (E) TEM of an anaphase SPB (arrows) in wild-type (left) or gtb1-PL301 mutant (right) cells (upper images). Lower image, a spindle in gtb1-PL301. Cells were grown at 23°C. N, nucleus; C, cytoplasm; SP, spindle. Bar (in A–D), 5 μm. Magnification for TEM images, 19,080× for SPB images; 7590× for the spindle.

