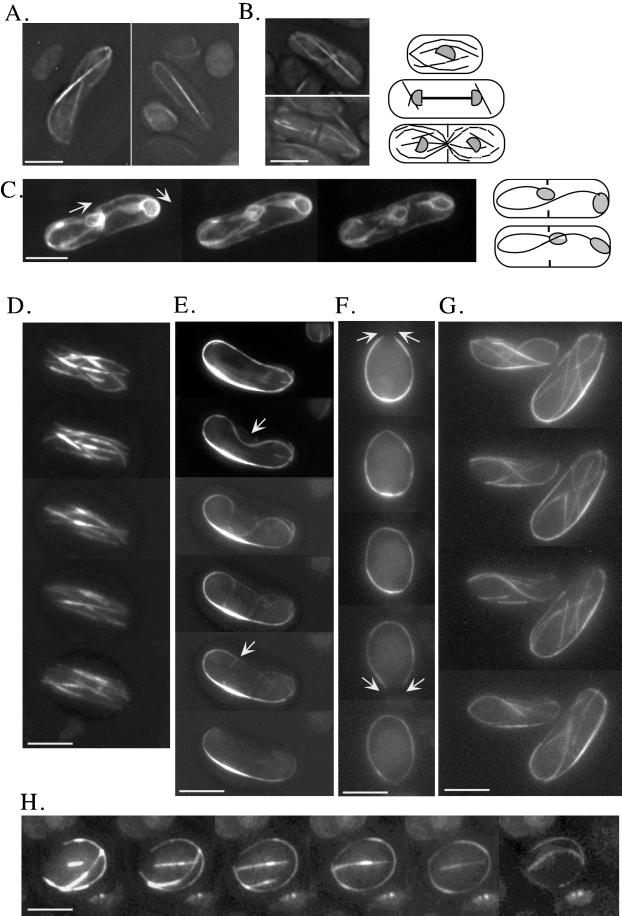
Figure 5.
Time-lapse video microscopy of microtubule dynamics in living wild-type and gtb1-PL301 cells (for details see MATERIALS AND METHODS). Microtubules were visualized in gtb1-PL301 cells, with only the native copy of pkl1 present, using a GFP-α-tubulin fusion protein. Images shown are 3D projections of all microtubules. Projections are generated from a series of images taken through the cell at a Z-spacing of 0.2–0.4 μm. Representative examples show the γ-tubulin mutant of spindles at 19°C (A) and retained spindles with postanaphase microtubule arrays at 23°C (B) viewed using GFP-α-tubulin. The diagrams to the right depict normal wild-type patterns of microtubule dynamics in G2, anaphase B, and cytokinesis (for review, see Hagan, 1998). (C–H) 3D time-lapse video microscopy of spindle and microtubule behavior in the mutant. Selected frames are shown. Entire movies are available. (C) GFP-NADPH cytochrome P450 reductase is used as a nuclear envelope marker to confirm that spindle elongation can curve around the cell ends. Arrows indicate the result of pushing forces from spindle elongation. The diagrams at the right show the beginning and end stages. (D–H) 3D time-lapse video microscopy of microtubules in wild-type (D) and the mutant (E–H). See RESULTS for details. Bar, 5 μm.

