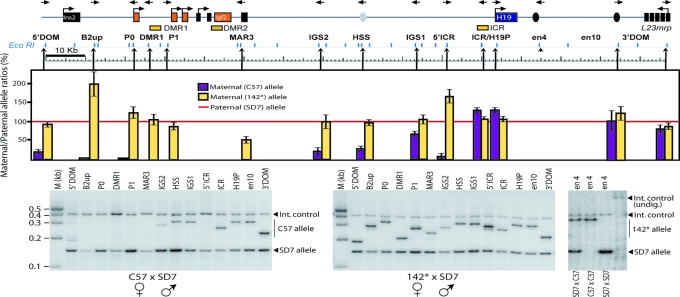
Fig. 1.
Parent-of-origin-specific patterns of physical proximity between the H19 endodermal enhancer and the Igf2/H19 domain in neonatal liver. H19, Igf2, and the flanking Ins2 and L23mrp genes are indicated by squares. The orientation of the primers used is represented by the direction of the arrows at the top of the diagram. EcoRI restriction enzyme sites that are present all along the locus are shown below the locus diagram, whereas arrowheads pointing up show the location of the 3C primer with reference to the corresponding EcoRI restriction site. The hot-stop PCR analysis of the proximity between en4 and the entire Igf2/H19 domain was performed by comparing relative crosslinking frequencies between the maternal en4 allele and the rest of the locus after normalization of the wild-type paternal SD7 allele frequencies to 100% (red line). Also see Fig. 9 for direct comparison of frequencies of interactions. 3C analysis and allelic bias were corrected for as described in Supporting Materials and Methods. The rightmost image exemplifies a hot-stop PCR analysis of 3C samples, which were digested with KpnI to identify the SD7 allele. The completeness of the KpnI digestion was verified by incorporating a fragment covering the KpnI site, which is specific for the SD7 allele, as an internal digestion control. See Materials and Methods and Supporting Materials and Methods for additional information.

