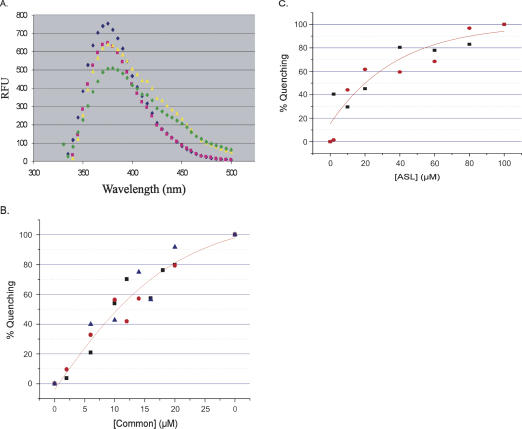
FIGURE 4.
Fluorescence spectroscopy of binding of the Specifier 2AP98 to Common and to ASLGlyGCC. (A) Fluorescence emission spectra were recorded for Specifier 2AP98 alone (blue diamond), reconstitution of the 5′-UTR Stem I complex between Specifier 2AP98 and Common (pink square), the binding of ASLGlyGCC to the Specifier 2AP98 and Common complex (green diamond), and the nonbinding control of ASLPheGAA (yellow triangle). Spectra in the presence of the ASLs have unexplained shoulders in the 400–450 nm range. (B) Binding of the Specifier 2AP98 half molecule to the Common half molecule. With the Specifier 2AP98 concentration constant (2.0 μM), the concentration of the Common half molecule was increased. Data were normalized and the percent fluorescence quenching (bound) was plotted vs. Common concentration. The binding curves were analyzed with a nonlinear regression (Origin). The error (±0.7 μM) was derived from the average of three experiments (black square, red circle, blue triangle). (C) Binding of ASLGlyGCC to the Specifier 2AP98/Common complex. The concentration of the Specifier 2AP98/Common complex was held constant (2.0 μM) as ASLGlyGCC was titrated into solution. Data were normalized and the percent fluorescence quenching (bound) was plotted vs. ASLGlyGCC concentration. The binding curves were analyzed with a nonlinear regression (Origin). The dissociation constant was derived from the average of two runs of the experiment (black square, red circle).

