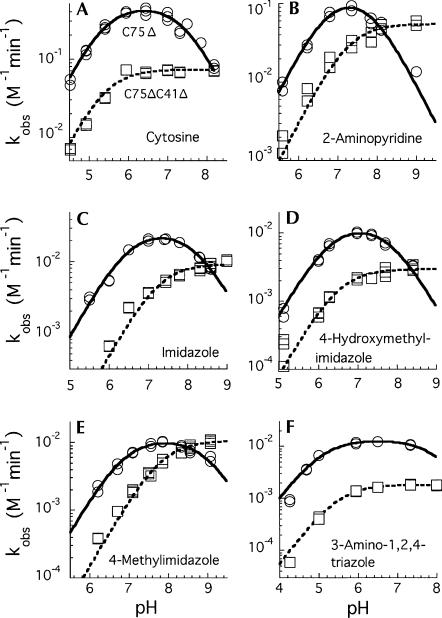
FIGURE 3.
pH-rate curves comparing the rescued cleavage rates for C75Δ (circles) and C75ΔC41Δ (squares) in the presence of exogenous base. The concentration of cytosine (A) was 37 mM and the reactions also contained 40 mM AMT or MTA buffer. The concentration of the bases in the other reactions (B–F) was 0.4 M. Rate constants were normalized to 1 M total base. Curves were fit to the data using the equations k obs = k max/(1 + 10(pKa1-pH) + 10(pH-pKa2) + 10(pKa1-pKa2)) for C75Δ, and k obs = k max/(1 + 10(pKa-pH)) for C75ΔC41Δ. Apparent pKa values are given in Table 1.

