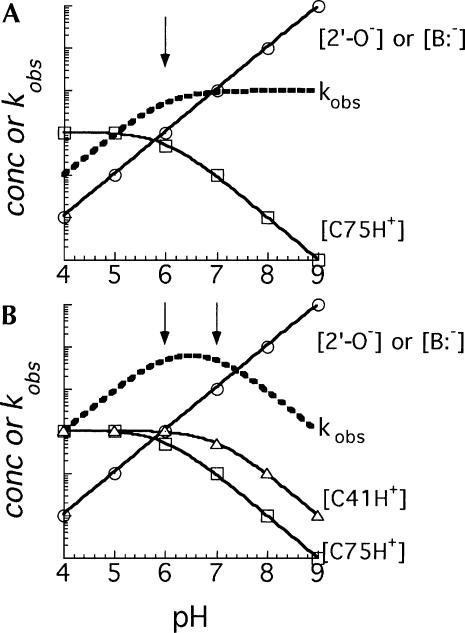
FIGURE 7.
Idealized examples of how the shape of a pH-rate curve would relate to the extent of protonation of ionizable groups. (A) A general-base pH-rate curve (dotted line) resulting from specific-base plus general-acid catalysis. An increase in the concentration of the activated substrate (activation of the 2′-OH group by base) is represented by the line through circles, while the decrease in concentration of the conjugate-acid form of the nucleobase catalyst with a pK a of 6 (arrow) is represented by the line through squares. (B) A bell-shaped pH-rate curve (dotted line) resulting from specific-base plus general-acid catalysis and a second ionizable group that, when protonated, increases activity of the ribozyme. Lines through circles and squares as in A but in addition there is a third ionizable group (e.g., C41) with a pKa of 7 (triangles).

