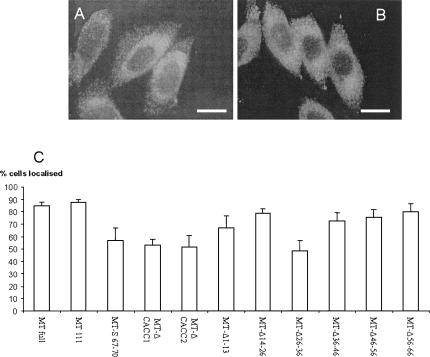
FIGURE 7.
Effects of deletions and substitutions in the 3′UTR on localization of MT-1. Results show immunostaining of cells after incubation with anti-XPress antibody and FITC-conjugated goat anti-mouse secondary IgG. Examples are shown of (A) cells exhibiting a distinct perinuclear localization of MT-1 (CHO cells expressing pcMT-111), and (B) CHO cells showing a diffuse, nonlocalized MT-1 distribution (cells expressing pcMT-Δ26–36). Bars represent 10 μm. (C) The staining pattern was quantified in cells transfected with a range of constructs by examining at least 100 cells for perinuclear localization of MT-1 and scored as showing localization or not. Mean % of cells exhibiting localization ± SEM are shown from at least three separate experiments.

