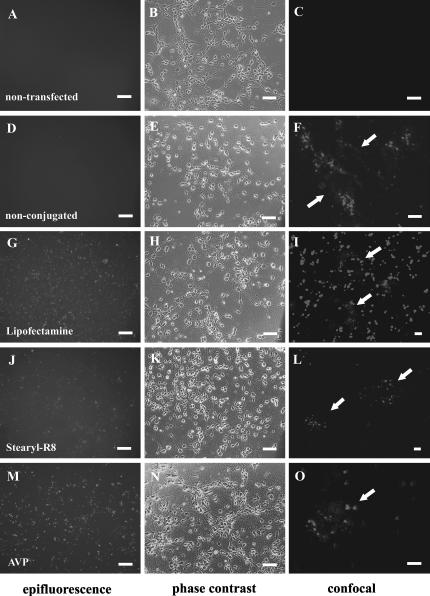
FIGURE 1.
SiRNA transfection of primary hippocampal neuron cultures. Epifluorescence (left), corresponding phase contrast (middle) overview images and confocal microscopy (right) detail images of primary neuron cultures 24 h after transfection. Nontransfected cells are shown in A–C. SiRNA was applied nonconjugated (D–F) or conjugated with Lipofectamine (G–I), Stearyl-R8 (J–L), and AVP (M–O). Epifluorescence images demonstrate the distribution of siRNA conjugates in the culture with variable aggregate formation. Confocal images show the intracellular distribution of labeled siRNA within granular structures 72 h after transfection in greater detail. Individual cells in confocal images are labeled with arrows. Bars in epifluorescence and phase contrast images, 50 μm; bars in confocal images, 10 μm.

