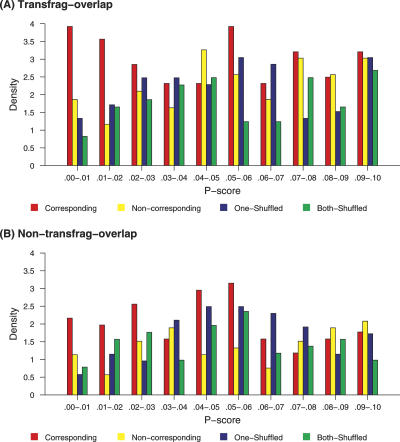
Figure 2.
Probability density histograms. The densities of the P-scores, in chromosome 20, for the corresponding pairs, noncorresponding pairs, pairs in which one sequence is shuffled, and pairs in which both sequences are shuffled. The histograms depict (A) the candidates that overlap transfrags and (B) the candidates that do not.

