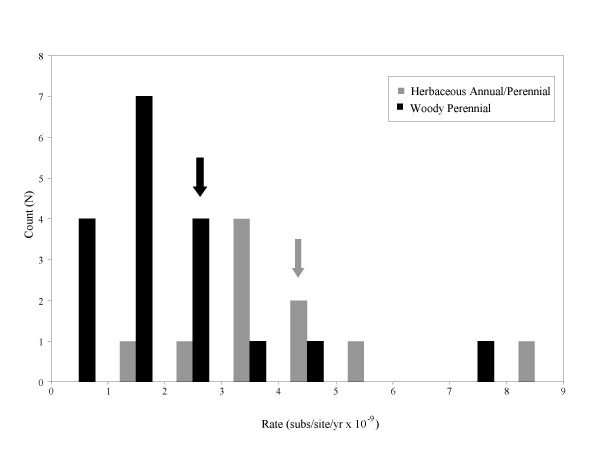
Figure 1.
The distribution of ITS rates. A frequency histogram of nrITS rates, showing the difference between woody perennial and herbaceous annual/perennial rates. Arrows indicate the average rates for each life history category. The outlier rate for Gentiana Sect. Cimialis (19 × 10-9 subs/site/yr) has been removed.

