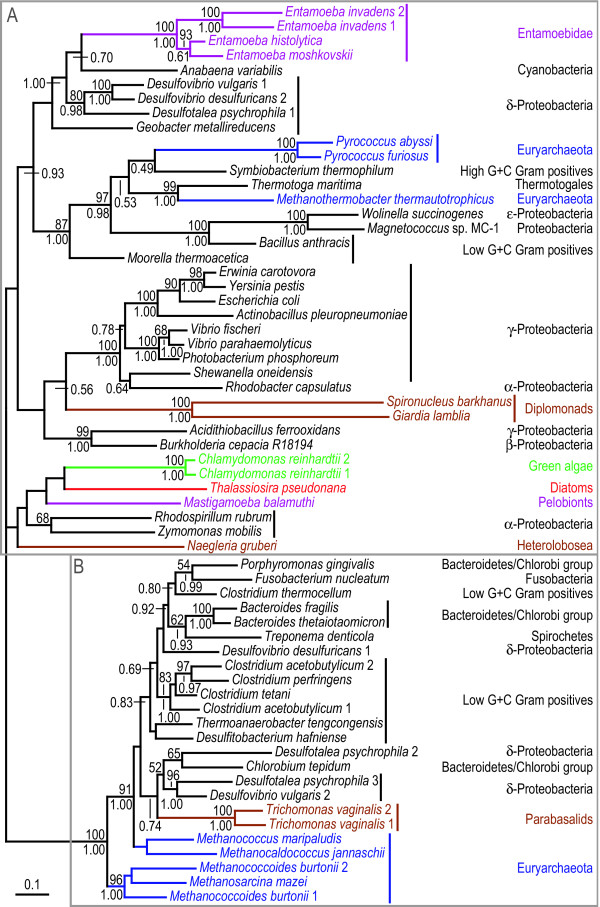
Figure 2.
Protein maximum likelihood tree of hybrid-cluster protein (priS gene). ML tree based on 417 unambiguously aligned aa positions of the hybrid-cluster protein. Bootstrap support values >50% from ML analyses are shown above the branches. Posterior probabilities for the Bayesian consensus tree of the grouped aa analysis are shown below the branches. When no space is available a line indicates the position of the support values. Absence of a posterior probability value at a node indicates that this node was lacking in the Bayesian consensus tree. Details about the phylogenetic analyses are found in the Methods section and AdditionalAdditional File 2. The grey boxes A and B indicate strongly separated groups which include eukaryotic sequences. The tree is arbitrarily rooted. Eubacteria are labelled black, Archaea are labelled blue, and the Eukaryotes are labelled according to their classification into "super-groups" [29, 30]: opisthokonts (orange), amoebozoa (purple), chromalveolates (red), plants (green) and excavates (brown) (see Figure 1).

