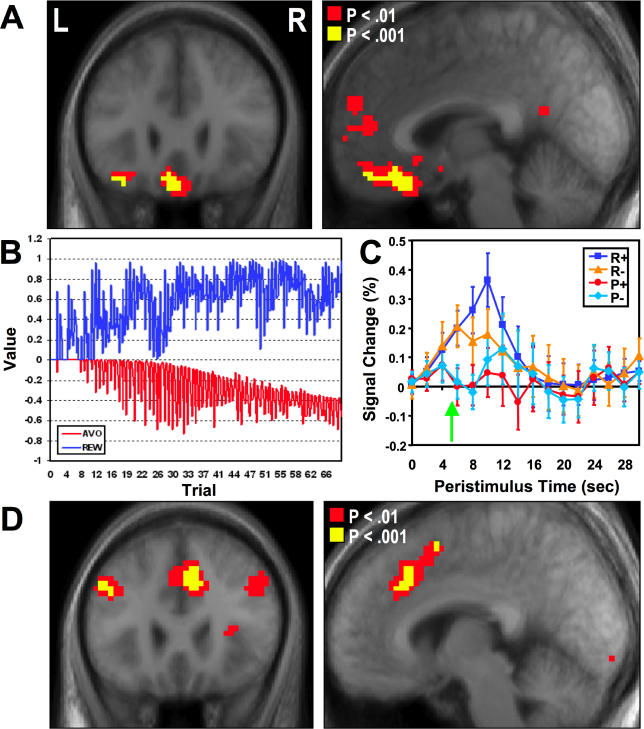
Figure 3. Responses Related to Expected Value.
(A) Brain areas correlating with expected reward value in both the avoidance and reward trials, revealing significant effects in medial and lateral OFC.
(B) Illustration of an expected value signal shown for each trial over the course of the experiment from a typical participant. This signal is generated by the computational model after passing that participant's behavioral data to the model as input. In the reward trials, this value signal increases over time, reflecting the fact that as rewards are obtained over the course of learning, the expected value of the chosen action on the reward trials increases as it is updated over the course of learning. The value signal in the avoidance trial decreases over time, reflecting the fact that as aversive outcomes are obtained over the course of learning, the expected reward value of the currently chosen action decreases as it is updated.
(C) Plot of time course taken from the medial OFC showing responses occurring from trial onset. The time of outcome delivery is 4 s into the trial. This plot illustrates an increase in activity from the beginning of the trial on reward trials and a decrease in activity on avoidance trials. The time courses further diverge following the outcome (marked as a green arrow): trials in which a reward is delivered show further increases in activity compared to trials in which a reward is omitted, whereas trials in which an aversive outcome is omitted increase in activity relative to trials where an aversive outcome is delivered (reflecting the effects shown in Figure 2B).
(D ) Brain regions correlating negatively with expected reward value . These areas include the bilateral dorsolateral prefrontal cortex and the anterior cingulate cortex.

