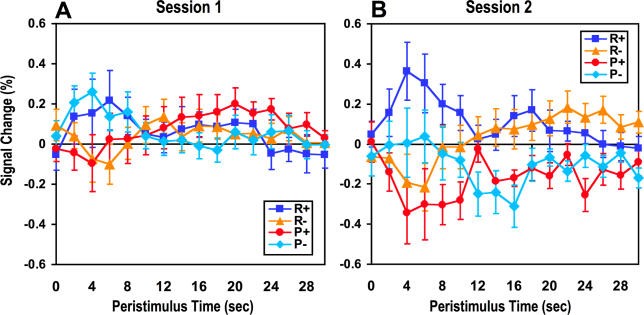
Figure 5. Time-Course Plots in Medial OFC for the Two Sessions Separately.
Time-course plots showing the trial averaged BOLD signal in the medial OFC, separately for the first (A) and second (B) half of the experiment.
The reward response does not decrease toward baseline by the second half of the experiment, nor does the punishment signal increase toward baseline, as would be expected for a PE signal.

