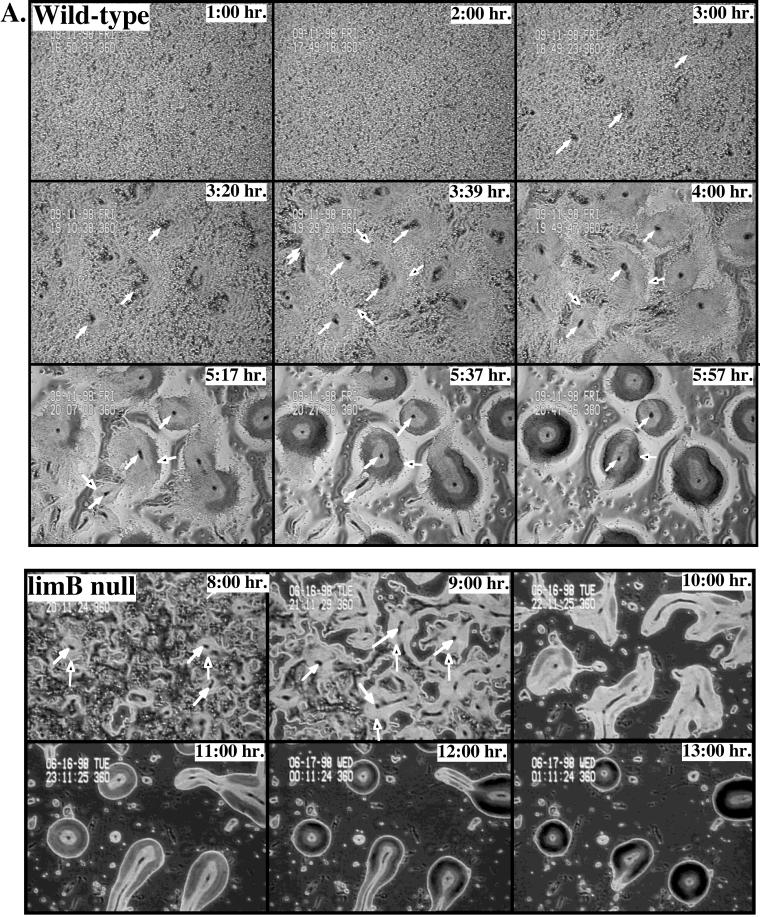
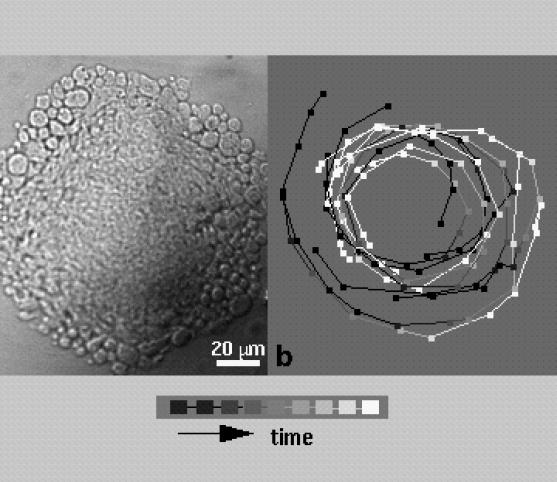
Figure 4.
Time-lapse video microscopy of aggregating cells. (A, top panels) Wild-type cells. (A, bottom panels) limB null cells. Washed, starved cells were plated as an ∼95% confluent monolayer on thin agar, and aggregation was recorded by time-lapse video, phase-contrast microscopy as described previously (Ma et al., 1997; Meili et al., 1999) (see MATERIALS AND METHODS). Some of the aggregation centers are indicated by a solid, white arrow. The outside of aggregation domains is indicated by a solid black arrow. (B) Rotational cell trajectories in limB null mounds. A small number of Act15/GFP-tagged limB null cells were mixed with unlabeled limB null cells and allowed to aggregate. Time-lapse fluorescence movies were collected to assess cell motion. Left, bright-field view of a limB null mound. Right, trajectories of fluorescently tagged cells from the same mound. A cell's center of mass is indicated by a square with a gray scale that indicates the flow of time. Lines connecting the squares represent successive positions of the same cell. Time points are separated by 2-min intervals.


