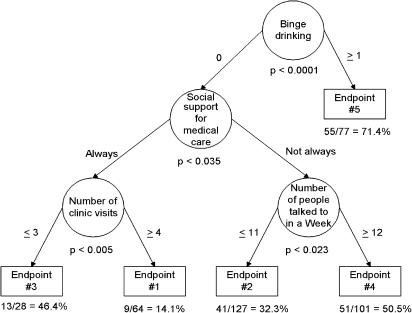
FIGURE 2.
Schematic illustration of the classification tree analysis model for predicting preventable admission. Circles represent nodes (decision points), ars indicate branches (decision paths), and rectangles represent prediction end points. The generalized type I error is given by the numbers underneath each node. Numbers/words adjacent to ars indicate the value of the cutpoint or category for each node. End points are numbered from 1 to 5 based on increasing proportions of hospitalizations that were preventable (vs nonpreventable). Percentage of total sample classified by each attribute: binge drinking (N=397, 99.3%), social support for medical care (N=320, 80.0%), number of people talked to in a week (N=228, 57.0%), number of prior clinic visits (N=92, 23.0%).

