Figure 4.
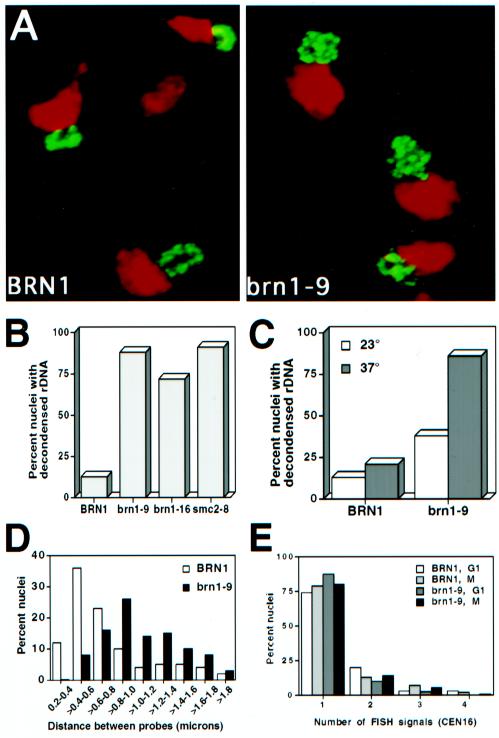
Chromosome condensation and chromosome cohesion in brn1 mutants at the restrictive temperature. (A) FISH analysis of rDNA morphology in brn1 mutants. Exponentially growing strains CH2523 (BRN1) and CH2524 (brn1-9) were synchronized in G1, shifted to the nonpermissive temperature (37°C), and released into medium containing nocodazole (37°C) to rearrest the cells in mitosis. Cells were fixed and processed for FISH with the use of DIG-labeled rDNA as the probe with FITC-conjugated secondary antibodies (see MATERIALS AND METHODS). Micrographs show the rDNA signal in green and the bulk DNA (propidium iodide stain) in red (false colors). (B) Quantitation of rDNA morphology. Strains CH2523 (BRN1), CH2524 (brn1-9), CH2525 (brn1-16), and 1aAS330 (smc2-8) were treated as described for A. Amorphous rDNA signals were scored as decondensed, and clear loop or string-like structures were scored as condensed. In each sample, >100 nuclei were counted. (C) Maintenance of rDNA condensation. Strains CH2523 (BRN1) and CH2524 (brn1-9) were arrested in early mitosis in medium containing nocodazole for 2 h at the permissive temperature (23°C) to allow chromosome condensation to occur. The cultures were then shifted to the restrictive temperature (37°C) for 1 h. The state of rDNA condensation was monitored by FISH as described for A both before (23°C) and after the shift to restrictive temperature (37°C). Scoring of samples was as described for B. More than 100 nuclei were scored per sample. (D) Chromosome condensation of unique chromosome XVI sequences. Cells were prepared as described for A and probed by FISH with the use of a CEN16 proximal probe and a second chromosome XVI probe 250 kb away (see MATERIALS AND METHODS). Distances between FISH signals are shown as the percentage of total measurements in each category among nuclei exhibiting two signals. The average distance between signals is 0.75 ± 0.08 μm (n = 83) for BRN1 and 1.07 ± 0.11 μm (n = 101) for brn1-9. Nuclei with greater or fewer than two signals were not included in the analysis. (E) FISH analysis of chromosome cohesion. Nocodazole-arrested cells (37°C) prepared as described for A were analyzed with a CEN16 proximal probe, and the number of signals per nucleus was scored. At least 100 nuclei were counted per sample.

