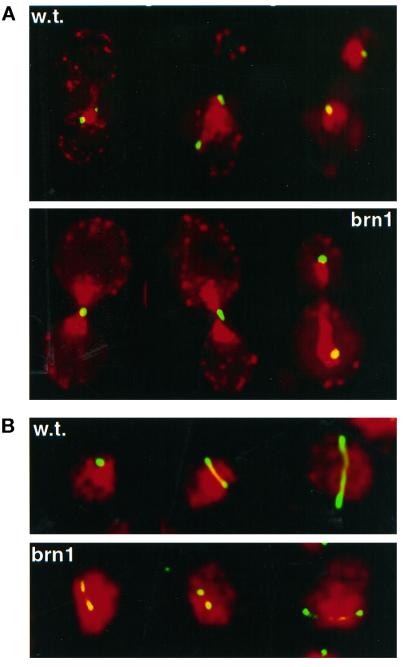
Figure 3.
(A) Chromatid separation and segregation in BRN1 (w.t.) and brn1–60 mutant cells. Centromere of chromosome IV, visualized with LacI::GFP, is shown in green; cell nuclei, stained with DAPI (pseudocolored), are bright red; the outline of the cells is visible as red background. Exponentially growing cultures were shifted to 37°C for 3 h and processed for microscopy. (B) Examples of mitotic spindle morphology in BRN1 (w.t.) and brn1–60 cells incubated at 37°C for 3 h. Antitubulin immunofluorescence is shown in green; DNA stained with DAPI is pseudocolored red.

