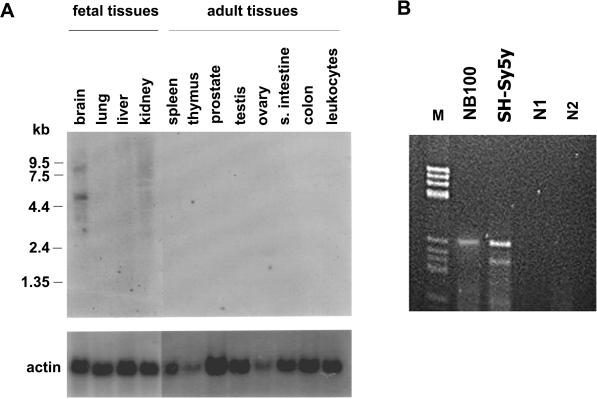
Figure 2.
Analysis of ADAM 23 expression in human tissues and cell lines. (A) Approximately 2 μg of polyadenylated RNA from the indicated tissues were analyzed by hybridization with the full-length cDNA isolated for human ADAM 23. The positions of RNA size markers are shown. Filters were subsequently hybridized with a human actin probe to ascertain the differences in RNA loading among the different samples. (B) Reverse transcription-PCR analysis of ADAM 23 expression in human neuroblastoma NB100 and SH-Sy5y cells. N1 and N2 indicate negative controls for each cell line. M, molecular size markers.

