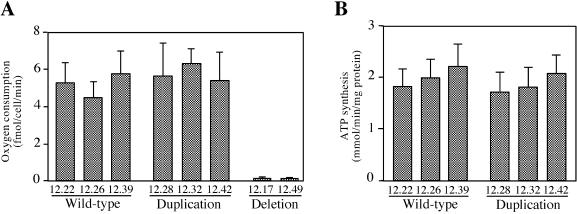
Figure 2.
Biochemical function in homoplasmic cybrids from patient 1. (A) Rates of oxygen consumption per cell of the indicated cybrid cell lines (the digits under each bar denote the specific KAF4EB12.xx line analyzed; see Table 1) are shown (average of six measurements). (B) Rates of ATP synthesis of the indicated transmitochondrial cell lines are shown (average of four measurements per line). Each error bar represents 1 SD.

