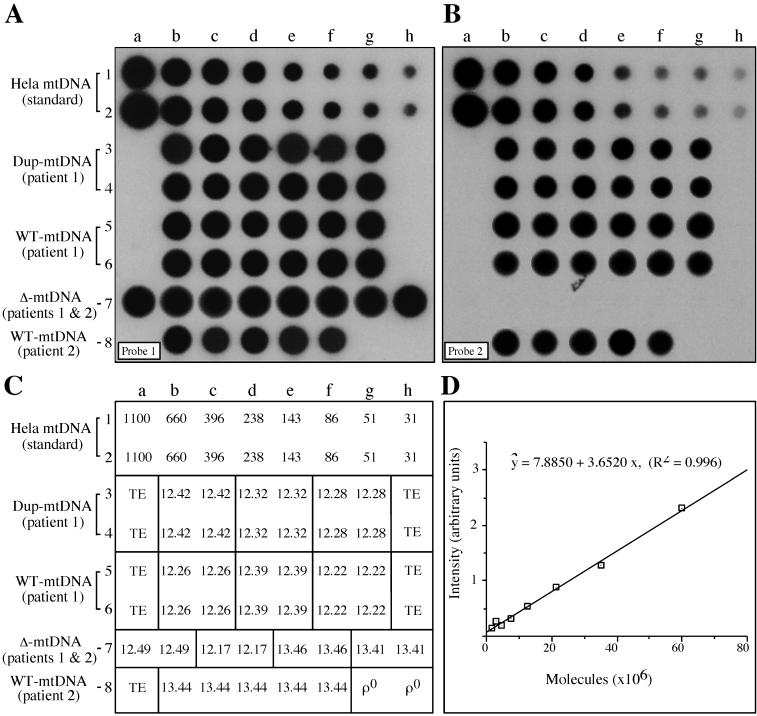
Figure 4.
Quantitation of mtDNA. A representative dot blot analysis is shown. Duplicated serial dilutions of purified HeLa cell mtDNA (numbers indicate pg mtDNA spotted) and cell lysates from control ρ0 cells and from wild-type, duplicated, and deleted lines from patient 1 (cybrid clones12.xx from KAF4EB12; see Table 1) and patient 2 (cybrid clones 13.xx from 206/F4 3.13; see Table 1) were spotted according to the scheme shown in C. Multiple wells identified by the same cell line number denote samples that were collected at different cell passages. Each test well contained DNA from the lysis of 2500 cells. The membrane was hybridized first with probe 2 (B), stripped, and then hybridized with probe 1 (A). The dots were quantitated, and the amount of mtDNA in the various lines was calculated using the standard curve drawn from the HeLa cell data (D). TE, 1× Tris-EDTA buffer control for background.

