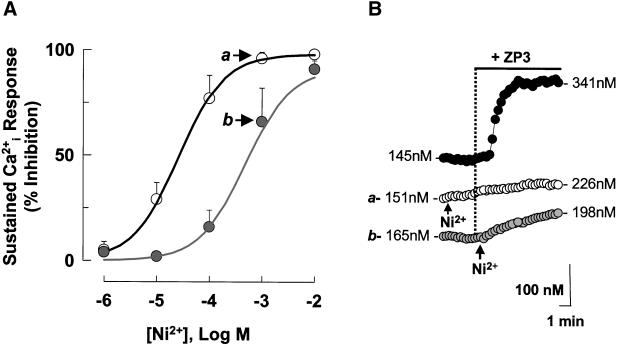
Figure 4.
Ni2+ inhibits Ca2+i responses to ZP3. Ni2+ was added either 2 min before (○) or 15 s after ZP3 ( ). Response rates (ΔCa2+i/Δt) were determined as described (Figure 1). (A) Data are means ± SD of observations on 7–22 cells and are fit to the expression I = (100 × IC50)/(IC50 + C), where I is the inhibition of response rates in the presence Ni2+ and C and IC50 are the specific Ni2+ concentration and the concentration that inhibits Ca2+i response by 50%, respectively. Calculated values of IC50 were 26 μM for Ni2+ before ZP3 (black line) and 481 μM for Ni2+ after ZP3 (gray line). Letters (a and b) designate points that are illustrated by traces in B. (B) Montage of traces showing sperm treatment with 10 μg/ml ZP3 (●), with 1 mM Ni2+ added 15 s after ZP3 ( ), or with Ni2+ added 2 min before ZP3 (○).

