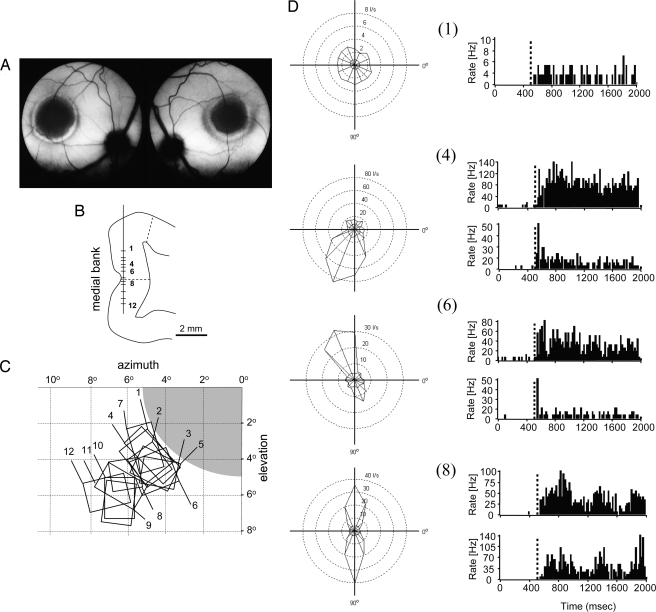
Fig. 1.
Retinal lesions, RF topography, and single cell responses 4 weeks after lesion. (A) Fundus photographs of the left and right eyes of a cat with homonymous photocoagulator lesions of 10° diameter centered to the area centralis in both eyes. (B) Tangential recordings along the medial bank and sample recording sites (1–12) along a single penetration from an animal 4 weeks after lesion are shown on a schematic drawing of a frontal section. Dashed lines indicate the borders of the LPZ as determined for 10°-diameter lesions with zif/268 in situ hybridization (23, 25). (C) RF map of units recorded from the sample penetration shown in B. Retinal lesion is shown in gray. Units recorded in the LPZ have ectopic RFs at the retinal lesion border. (D) Polar diagrams of the visual evoked response for selected units (numbers indicated) and poststimulus time histograms of the responses to the preferred and null direction (stimulus onset at 500 ms). I/s, impulses per second.

