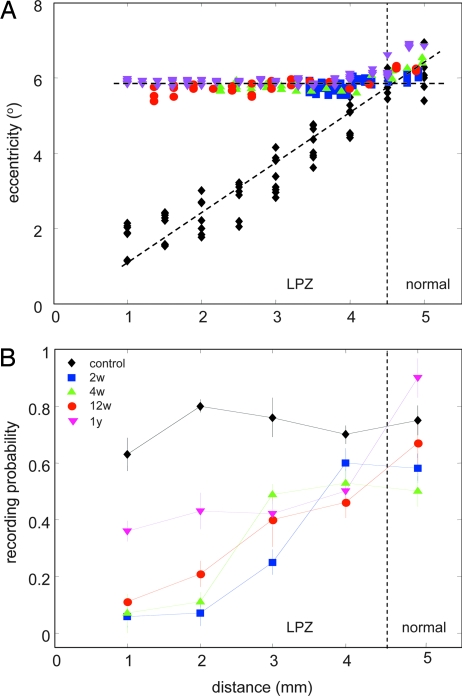
Fig. 2.
RF positions and recording probability in control and lesioned animals. (A) Eccentricity of RF positions in the visual field from one control animal (black diamonds) and all experimental animals at 2 (blue square), 4 (green triangle), and 12 (red circle) weeks, and 1 year (magenta triangle) plotted in dependence of recording distance along the medial bank. The intersection between the regression lines indicates the border between LPZ and normal cortex. (B) The probability of recording spiking cells from positions separated by 150–300 μm within each 1 mm along the medial bank is shown for control, the 2-, 4-, and 12-week, and 1-year animals. All symbols and colors are as in A.

