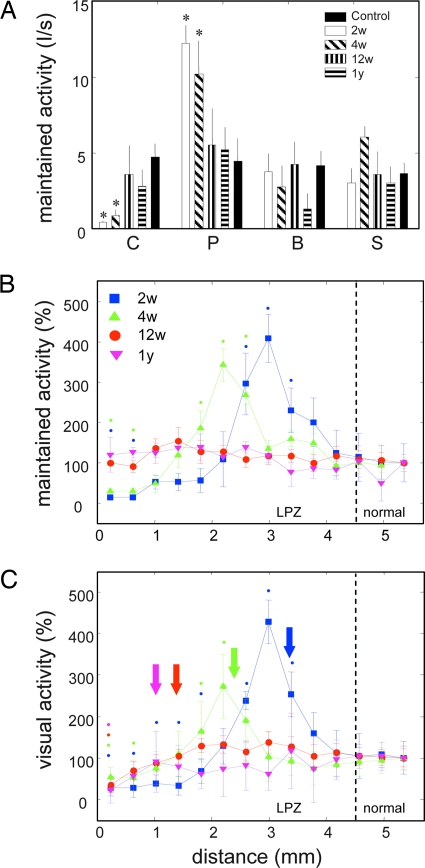
Fig. 3.
Maintained and evoked activity in the LPZ at different recovery times. (A) Maintained activity in different characteristic zones of the LPZ. C, deafferented center; P, activity peak; B, border region of the LPZ; S, surround of LPZ. Controls recorded at corresponding eccentricities and results from different survival times are shown. Error bars are SEM. Asterisks indicate significant deviations from the normal surround (P < 0.05). I/s, impulses per second. (B) Normalized maintained activity as a function of increasing recording distance along the medial bank (see Fig. 1B). Activity outside the LPZ is set to 100% for each survival time. A peak of maintained activity is found progressively inside the LPZ at 2 and 4 weeks. Error bars and color coding of survival times are as in Fig. 2B. Color-coded dots indicate points where activity was significantly higher or lower compared with normal surround at respective survival times (P < 0.05). (C) Normalized maximal response to a drifting grating of preferred orientation and direction of motion. Normalization, color coding, and symbols are as in B. Color-coded arrows indicate the position of the first well defined RFs for different survival times.

