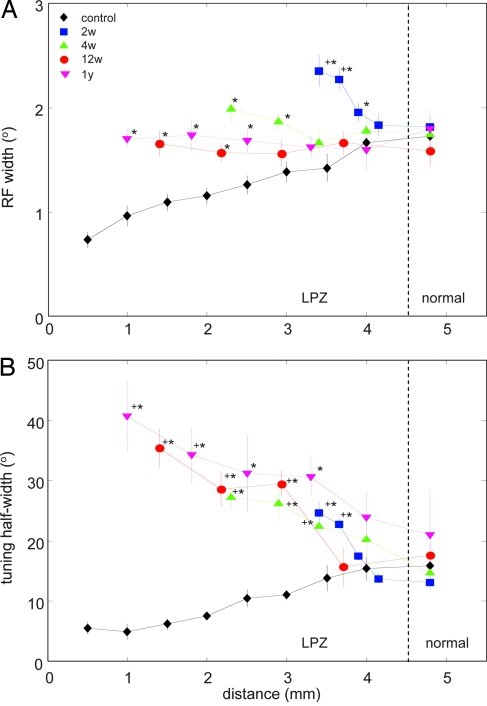
Fig. 4.
Degree and limits of RF width and orientation tuning recovery. (A) RF widths from all recovery periods compared with normal RF widths recorded at corresponding eccentricities in control animals. Recording distance is defined as in Fig. 3B. Statistically significant differences at the 5% level are indicated by ∗; + indicates significant differences of RFs in the LPZ from those in the normal surround at each given survival time (color coding is as in Figs. 2 and 3). Error bars are SEM. (B) Orientation tuning half-width with increasing recording distance along the medial bank and eccentricity in the visual field. For explanation see Results. Color coding and symbols for significance are as in A.

