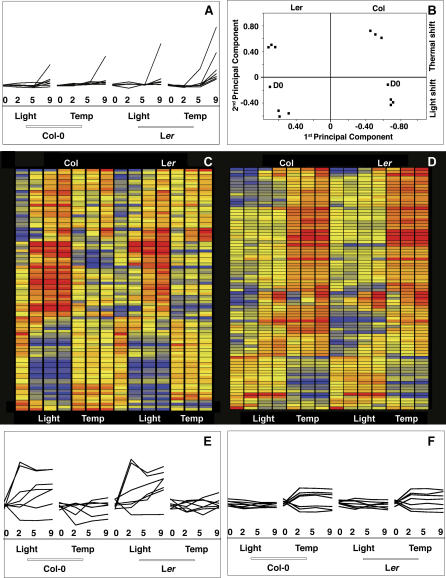
Figure 5. Genomic Responses at the Shoot Apex to Light or Temperature Treatment.
For (A), (E), and (F), the day of sample collection (0, 2, 5, and 9), type of shift (light-photoperiodic shift, temp-thermal shift) and the background (Col-0 and Ler) are given in the x-axis. Log-normalized expression levels are plotted along the y-axis. The scale is the same for all three panels.
(A) Response of floral marker genes (AP1, FUL, AP3, PI, AG, SEP1–3) to light and temperature shifts.
(B) Principal component analysis. x-axis: first principal component explaining 39.5% of the variation, which appears to be mostly due to genetic differences between Ler and Col (indicated above). y-axis: second principal component explaining 25% of the variation. The second component mostly distinguishes light versus temperature treatment (shown to the right).
(C, D) Most genes that show alterations in expression levels (significantly different between day 0 and day 9 based on logit-T) appear to be specific to the type of induction (thermal or photoperiodic). Red indicates expression levels above average across all experiments; blue, levels below average. The left panel shows genes that are induced by light (top) or repressed by light (bottom), but largely unchanged in response to temperature. The right panel shows genes with the opposite behavior.
(E) Examples of light specific changes in expression profiles (CCA1, GI, COL2, SUMO3, AGL6, CRC, and TFL1).
(F) As examples of temperature specific changes in expression profiles, several genes encoding SR proteins and genes associated with the Gene Ontology term “RNA processing” are shown (At2g24590, At5g46250, At1g55310, At1g09140, At1g51510 and At2g27230).

