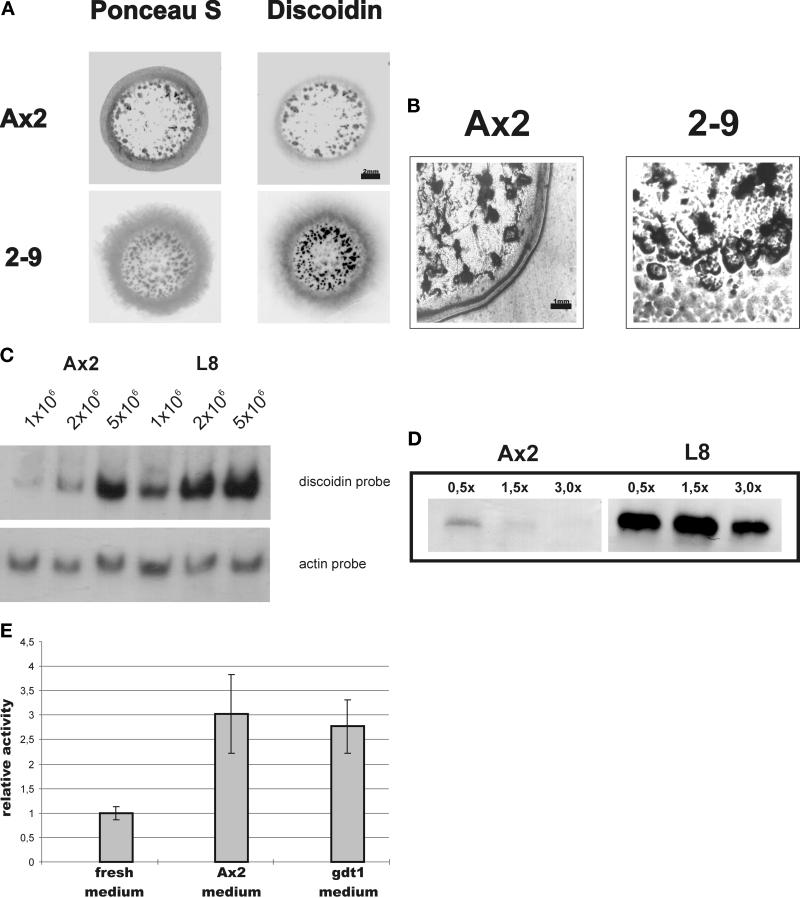
Figure 1.
Analysis of the gdt1− mutant. (A) Colony blots of wild-type Ax2 and mutant 2-9. Colonies of 1–2 cm diameter growing on a lawn of K. aerogenes were first stained with the anti-discoidin monoclonal antibody 80-52-13 (Wetterauer et al., 1993) and an alkaline phosphatase-coupled secondary antibody. The blot was then counterstained with Ponceau S. In the wild type, a sharp outer ring of discoidin-negative, feeding amoebae is seen, whereas the 2-9 mutant shows strong antibody staining in a broad fuzzy rim around the colony. Discoidin protein is also accumulated to higher levels in the mutant. (B) Microscopical image of feeding edge morphology. Although the Ax2 colony displays a smooth, regular growth zone, 2-9 mutant cells form aggregates close to the feeding edge, and cell masses outside of the plaque are observed. This results in a ragged colony shape. (C) Premature expression of discoidin in the gdt1− mutant. Ax2 and L8 cells were harvested from bacterial suspension cultures at the cell densities indicated. RNA was isolated, separated on a denaturing agarose gel, blotted to a nylon membrane, and hybridized first with a discoidin and then with an actin probe as a control. Equal amounts of RNA were loaded as determined by measuring the OD260 and confirmed by staining rRNA with ethidium bromide. (D) Sensitivity of the gdt1− mutant to nutrient supply. Ax2 and L8 cells were grown in 0.5, 1.5, and 3× concentrated KA suspension and harvested at a density of 106 cells/ml. Total protein was separated by SDS-PAGE, and discoidin was detected with the specific monoclonal antibody. Equal amounts of protein were loaded. (E) PSF production of Ax2 and gdt1−dt1− cells. Ax2 and gdt1− cells were grown in KA suspension to 5 × 10⁶ cells/ml; the conditioned buffer was used to grow DAG cells; and β-galactosidase activity was measured when a density of 106 cells/ml was reached. As a control, DAG cells were grown in medium with fresh buffer. β-Galactosidase activity is given relative to the activity in fresh medium (set to 1). The average of three experiments is shown.

