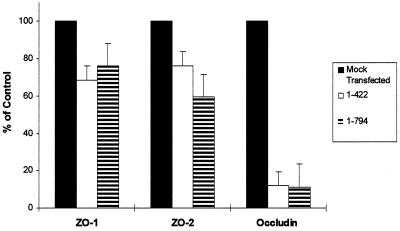
Figure 5.
Expression levels of tight junction-associated proteins in the ZO-11–422 and ZO-11–794 cells. The levels of ZO-1, ZO-2, and occludin in these cells were quantitated by densitometric scans of Western blots probed with the indicated antibody. The levels of ZO-1, ZO-2, and occludin in ZO-11–422 cells (white bar) and ZO-11–794 cells (hatched bar) were expressed relative to mock-transfected cells (black bar). The bars represent the mean ± SEM of triplicate determinations.

