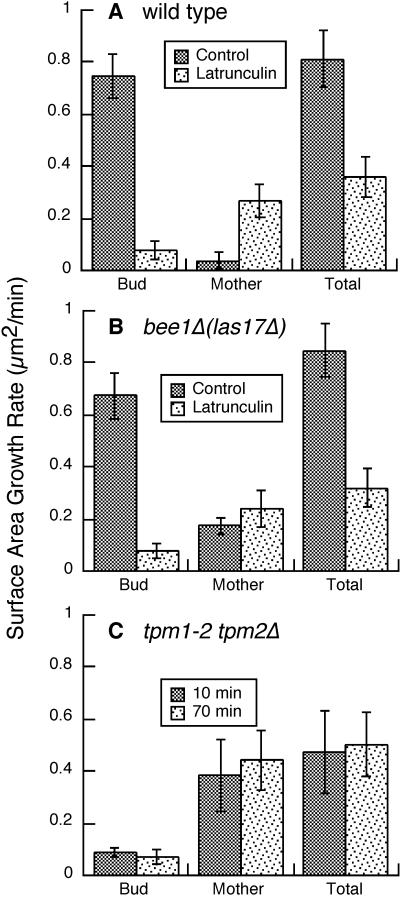
Figure 3.
Effect of depolarization of cortical actin patches, latrunculin treatment, and loss of actin cables on cell growth. Surface area growth rates are plotted for wild-type cells with and without latrunculin (A), bee1Δ(las17Δ) mutant cells with and without latrunculin (B), and tpm1-2 tpm2Δ cells incubated at the restrictive temperature for 10 or 70 min (C). The values are the mean growth rates for small-budded cells. Error bars represent SEM. Number of cells: wild-type control, 10; wild-type latrunculin, 9; bee1Δ(las17Δ) control, 19; bee1Δ(las17Δ) latrunculin, 4; tpm1-2 tpm2Δ 10 min, 6; tpm1-2 tpm2Δ 70 min, 5. Strains were as follows: wild type, YJC1411; bee1Δ(las17Δ), RLY157, YJC1682, and YJC1691; tpm1-2 tpm2Δ, ABY971.

