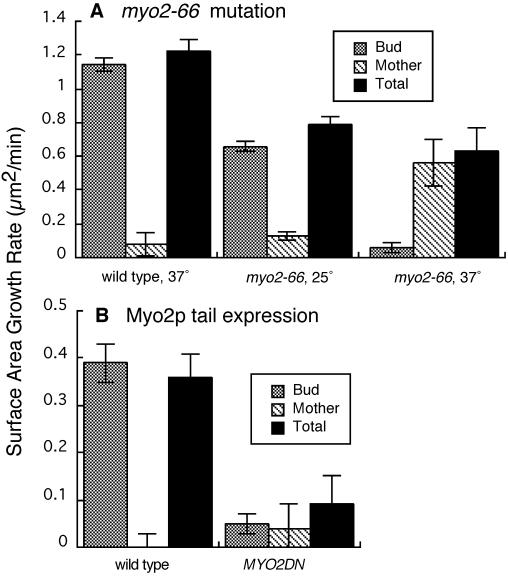
Figure 6.
Effect of inhibition of Myo2p on cell growth. Mean values for surface area growth rate are plotted. Error bars represent SEM. (A) Wild-type and myo2-66 cells at 25 or 37°C. (B) Wild-type and MYO2DN cells in galactose. Number of cells: (A) wild-type 37°C, 11; myo2-66 25°C, 8; myo2-66 37°C, 9; (B) wild-type, 6; MYO2DN, 13. Strains were as follows: wild type, YJC1454; myo2-66, GR663-13; MYO2DN, YJC1779.

