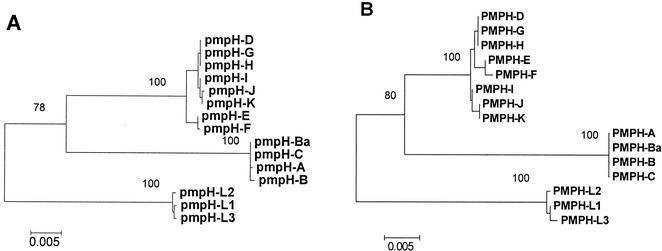
FIG. 6.
Evolution of pmpH indicates strong divergence of serovars compatible with disease groups. Phylogenetic trees based on the nucleotide (A) and inferred amino acid (B) sequences of pmpH. Bootstrap values are shown only at the nodes separating major clades and only when they exceeded 50%. Based on pmpH, the 15 serovars clearly evolve into three distinct disease groups, with strong bootstrap support (∼100%) for the three clades. The scale bar equals a corrected sequence divergence of 0.005, which is the same as the scale used in Fig. 2 and 4. However, because there is significantly more divergence in pmpE and pmpH than in pmpI, the actual bars here and in Fig. 4 are similar in length compared to the elongated bar used in Fig. 2.

