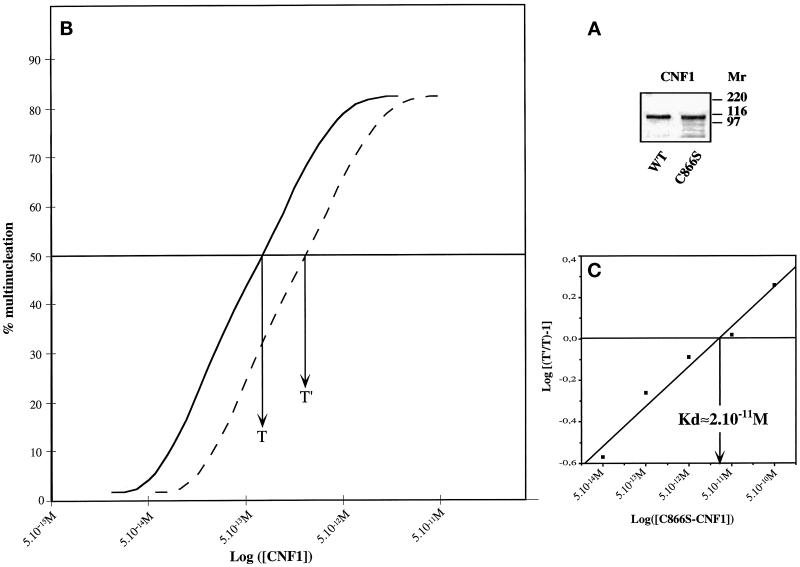
Figure 2.
Schild plot analysis for the determination of the CNF1 affinity to its cell receptor. (A) Purified wild-type CNF1 and CNF1-C866S used in this study. Approximately 2 μg of each protein were loaded on 10% SDS-PAGE, and the gel was fixed and stained with Coomassie blue. Molecular masses are given in kilodaltons. (B) Typical curves showing the displacement of CNF1 effects (multinucleation of HEp-2 cells) after addition of a fixed concentration of CNF1-C866S; T, concentration of CNF1 to obtain 50% of multinucleated cells in 48 h; T′, that of CNF1 after addition of a given amount of CNF1-C866S, which gives the same percentage of multinucleated cells. (C) Data plotted according to the method of Schild (1957). The arrow indicates the affinity of CNF1-C866S determined by the Schild method.

