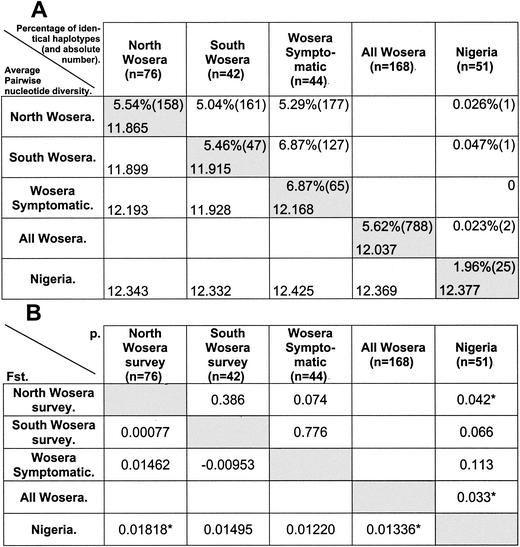
FIG. 2.
Geographical differences in ama1 domain I sequences. (A) (Upper right section [upper values in shaded cells]) Percentage (and absolute number in brackets) of sample pairs with the same haplotype (self-pairs not considered). The percentage of pairs with the same haplotype was calculated as the absolute number divided by the number of possible sample pairs, which was calculated as the product of the number of samples in the two populations for interpopulation comparisons, and as ∑1 → n−1n (where n is the number of samples in the population) for intrapopulation comparisons. (Lower left section [lower values in shaded cells]) Average number of pairwise nucleotide differences. Shaded and unshaded cells contain, respectively, intrapopulation and interpopulation values. (B) (Lower left section) Pairwise Fst estimates determined from pairwise nucleotide diversity. (Upper right section) Respective P values. Asterisks indicate significant differences (P < 0.05). “Nigeria” refers to published sequences from Nigeria (39).

