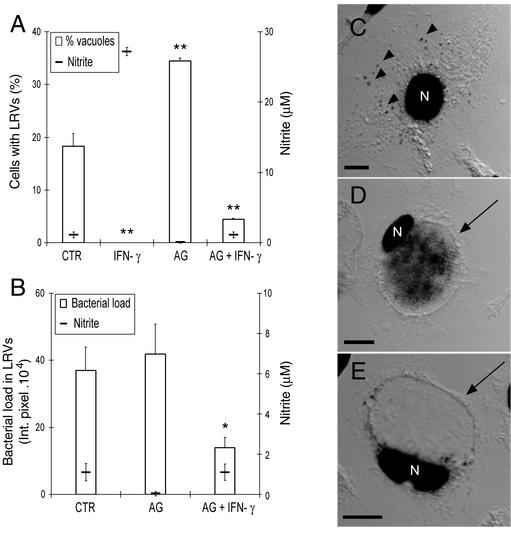
FIG. 5.
Effect of IFN-γ, AG, or both on the infection of BMMΦ with C. burnetii phase II. IFN-γ, AG, or both were added to the cultures, together with the bacteria, for 24 h. At that time cells were washed and kept in fresh drug-containing medium. At 6 days after infection, supernatants were collected for nitrite determination and cells processed as described in Materials and Methods. (A) Percentage of cells with LRVs and nitrite concentration in the same cultures. (B) Relative bacterial load in LRVs and the same nitrite concentration data shown in panel A on a different scale. Results are presented as the mean ± the standard deviation of one representative experiment from three experiments with similar results. Statistically significant differences between untreated control (CTR) and treated cultures are indicated (✽, P < 0.05; ✽✽, P < 0.01). (C to E) Confocal superimposed images of DAPI fluorescence (black) and Nomarski differential interference contrast (gray). The images show cells from cultures treated with IFN-γ (C), AG (D), or AG plus IFN-γ (E). The arrowheads indicate C. burnetii dispersed through the cytoplasm; the arrows indicate the large vacuole. N, cell nucleus. Bar, 10 μm.

