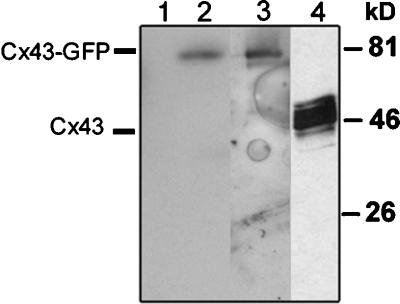
Figure 3.
Western blot analysis of Cx43–GFP expressed by mammalian cells. HeLa and COS-7 cells were transiently transfected with 10 μg Cx43–GFP or wild-type Cx43 cDNA, respectively, and were harvested. Cells were dissolved in SDS and analyzed by SDS-PAGE and Western blotting using an antibody to either Cx43 (Gap33) or GFP. Lane 1: control (mock-transfected HeLa cells). Lane 2: HeLa cells expressing Cx43–GFP stained with GFP antibodies. Lane 3: HeLa cells expressing Cx43–GFP stained with Cx43 antibodies. Two major bands are visible. The band at ∼71 kDa represents the Cx43–GFP (lanes 2 and 3), whereas the band at ∼65 kDa (lane 3) probably represents proteolytic products of Cx43. Lane 4: COS-7 cells expressing wild-type Cx43 stained with Cx43 antibodies. A broad band representing phosphorylated isoforms of Cx43 is evident at ∼48–50 kDa. The numbers on the right represent the location and molecular weight (kilodalton) markers.

