Figure 6.
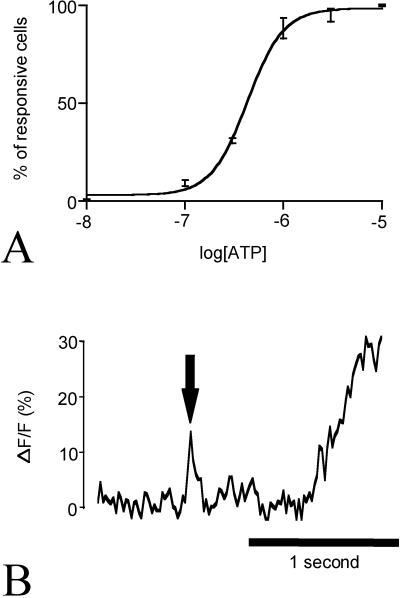
Intracellular Ca2+ changes of HeLa control cells in response to ATP. (A) The dose–response curve of the number of HeLa control cells showing an increase in [Ca2+]i in response to a range of ATP concentrations. Each data point represents the mean (±SE) of three separate experiments and >200 cells. (B) The relative changes in [Ca2+]i of a HeLa control cell represented by fluo-3 fluorescence in a 2.3 × 2.3 μm (7 × 7 pixels) perinuclear area with respect to time during exposure to 10 μM ATP, which was applied by solution exchange. Before global [Ca2+]i increases, a much smaller and transient [Ca2+]i change or Ca2+ puff (black arrow) could be observed with digital high-speed microscopy. The Ca2+ puff represents a ∼10% change in fluo-3 fluorescence.

