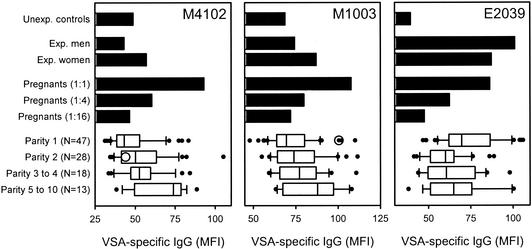
FIG. 1.
Plasma IgG recognition of VSA expressed by P. falciparum parasites isolated from the peripheral blood of pregnant women exposed to malaria (strain M1003 or M4102) and a child exposed to malaria (strain E2039) as measured by flow cytometry. The bar graphs show levels of IgG in pools of plasma from unexposed individuals (Unexp. controls), from P. falciparum-exposed men (Exp. men) and women (Exp. women), and in a fourfold-titrated pool of plasma from pregnant women with high levels of IgG specific for VSA expressed by parasites associated with pregnancy-associated malaria (Pregnants). The diagrams show VSA-specific IgG levels in individual plasma samples from primigravidae (Parity 1), secundigravidae (Parity 2), multigravidae (Parity 3 to 4), and grand-multigravidae (Parity 5 to 10). In each diagram, the vertical line indicates the median, the box indicates the 25 to 75% interquartile range, the horizontal “I” bar indicates the 10 to 90% interpercentile range, and the filled circles indicate all individual data points outside this range. The level of VSA-specific IgG in the autologous plasma sample is shown as an open circle.

