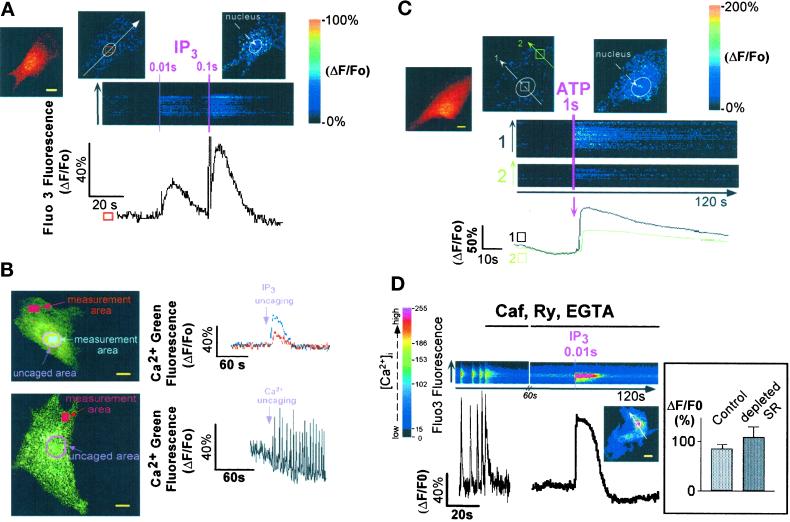
Figure 1.
Localized changes of [Ca2+]i in neonatal rat cardiomyocytes after photorelease of intracellular caged IP3 or extracellular caged ATP. (A) Caged IP3 was microinjected together with Fluo3 into cardiomyocytes, and IP3 was photoreleased by simultaneously scanning the optical field of the microscope with a UV laser beam. The duration of the scans (pink lines) is indicated at the top of the images. Images were acquired every 200–300 ms, and line scan images were built by setting a line crossing the cell (white arrow). The two images on top of the line scan show the cell (normalized fluorescence) before (middle) and after (right) IP3 release. The left cell image shows the Fluo3-loaded cell, after IP3 release. The graph represents changes in Fluo3 fluorescence in a region of interest shown by the square. Results (graph and images) are expressed as changes in fluorescence divided by the resting fluorescence (ΔF/Fo) to normalize the Fluo3 signals with the basal fluorescence. Similar results were obtained in seven cells. (B) IP3 (top) or Ca2+ (bottom) was photoreleased around the nucleus (pink area) from caged IP3 or Ca2+-saturated caged EGTA microinjected together with Ca2+ Green into cardiac cells. Note that Ca2+ was released to the same extent as the one released by IP3. The images were acquired using the LSM-510 confocal microscope (confocal section of 0.8 μm). The graphs show the intensity of the Ca2+ Green signal after normalization (ΔF/Fo) in different regions of interest (measurement areas). The panel is representative of at least seven experiments. (C) Cardiomyocytes were bathed in a Ca2+-free solution containing 1 mM caged ATP. ATP was photoreleased by a UV laser scan. Line scan images were built as described above. The two normalized images on top of the line scan show the cell before (middle) and after (right) ATP uncaging in the surrounding medium. The left cell image shows the Fluo3-loaded cell, after ATP release. The image is representative of at least five experiments. (D) A spontaneously beating cell was stopped by the addition of 10 mM caffeine (Caf) in the presence of 100 μM ryanodine (Ry) and 1 mM EGTA. Then after 1 min, IP3 was photoreleased. The graph (ΔF/Fo) shows the release of Ca2+ induced by IP3 in the region of interest delimited by the square; the line scan image was built as described above. Inset, the bar graph represents the changes in Fluo3 fluorescence induced by IP3 (10-ms UV laser scan), measured in an ROI including the whole cell, under control conditions (1.8 mM extracellular Ca2+) or after Ca2+ depletion of the SR (by application of 10 mM caffeine) followed by superfusion of the cell with ryanodine and EGTA (n = 7). Yellow bars, 10 μm.

