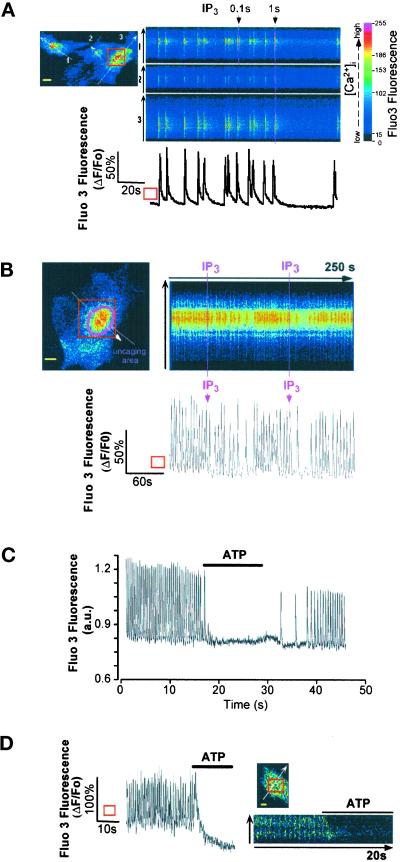
Figure 2.
(A) IP3 stops or slows Ca2+ spiking. Spontaneously beating cardiomyocytes injected with Fluo3 and caged IP3 were bathed in Ca2+-containing solution. IP3 was photoreleased by scanning the optical field with a UV laser beam (100 ms) that reached the cells at resting [Ca2+]i (first UV exposure) or at the peak of the Ca2+ transient (second UV exposure). The panel is representative of six experiments. (B) Spontaneously beating cardiomyocytes injected with Fluo3 and caged IP3 were bathed in Ca2+-containing solution. IP3 was locally photoreleased around the nucleus by “bleaching” (100 ms) with a UV laser beam the uncaging area. The panel is representative of three experiments. The graphs in A and B areexpressed as ΔF/Fo and represent changes in Fluo3 fluorescence in the ROI (square). (C and D) A spontaneously Ca2+-spiking cell loaded with Fluo3 was superfused with 20 μM ATP (indicated by horizontal bar), and Fluo3 fluorescence was monitored with a photomultiplier (C) or by imaging the cell by confocal microscopy (optical section of 0.8 μm; D). The line scan (D, right) was built as described in Figure 1. The graph in D is expressed as ΔF/Fo and represents changes in Fluo3 fluorescence in the ROI (square). Bars, 10 μm.

